Last year, deficit down....
3 June 2013
... by £10bn and this is £2bn more than target.
... by £10bn and this is £2bn more than target.
Good news. Much of this has come from Civil Service through cutting its size and from their pensions. Some short term one-off gains were also made by the sale of empty buildings.
This though is just a drop in the ocean and much more is needed to cut back the excess spending of government.
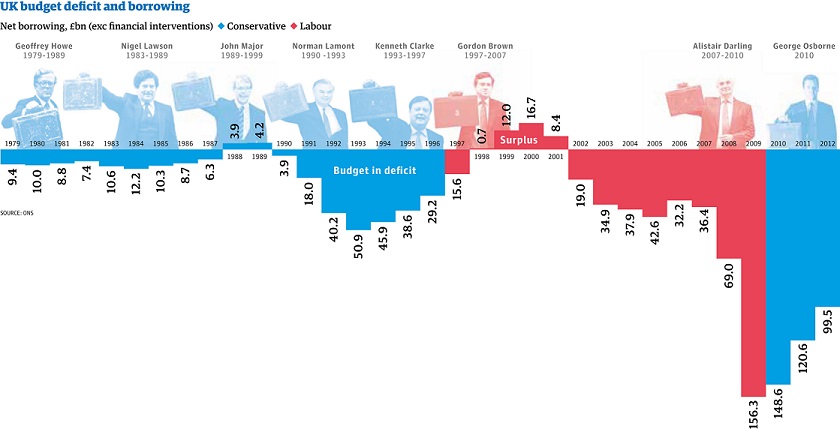
The graph below gives a good historical perspective on deficits.
What is important is the part of the economic cycle in which a deficit builds and that is not covered by the graph.
The reason Lamont was able to allow a deficit to rise in the 1990 recession was because of the good housekeeping previously to that, then the deficit was steadily reduced by Ken Clarke and continued after him until Brown was released from his election pledge to keep to Clarke's spending plans. Increasing the deficit by such large amounts after 2001 in the growth cycle was madness and that is why we had a structural deficit by 2005 as defined by a deficit that could not be cleared before the next cyclical downturn. It left the UK in an appalling position when the slowdown started in 2007.
- The increase in spending from 2000-2009 is extraordinary
- That would be the bailing-out of the banks David.
- So when did that occur Tom?
- No Tom - this is current account (deficit) spending not the amount borrowed. All the bank bail out money was borrowed.
- Barry do you seriously think that the Conservatives are going to solve this problem? If you do then I have a bridge you might like to buy.
- Barry, its a massive problem govt has communicating the simplest of messages. A huge % of the electorate doesn't understand the difference between debt and deficit.
- Deficit is the annual budget deficit.
Debt is the accumulated public (or national) debt adding all outstanding deficits. - Philip - who else is there?
The idiots that created this mess certainly cannot be trusted to do it. Every time they get to power they behave like children getting their sticky fingers in the sweetie jar.
The Conservatives have sorted out Labour's mess before and while they are going too slow they are at least heading in the right direction. - Barry I feel your pain. There is nobody there until there is a change in leadership in the conservative party and a turnaround of basic policy on many different issues. As it stands there is a vacuum which is exactly why UKIP have increased their voting share.
Meanwhile debt grows, growth doesn't and the energy bill is going through the commons.
Boy are we all stuffed. - We will need to get a Conservative government first though Philip. Don't forget we have not had one since Clarke left Labour his 'golden legacy' that was destroyed by Brown. Coalitions cannot do what is needed in tough circumstances.
- Barry I wished to God I shared your faith but with loonotik ministers like this tory berk surely you can't really believe that the tories have the answer?
This fella represents the broad consensus of tory thinking so let's see what he's got to say shall we?
https://twitter.com/grantshapps/status/341514119956017152/photo/1
Frankly it makes me feel somewhat bilious. - Oh noes!!!!!!
Yikes it's far worse than even I imagined. This is the official tory party energy twitter feed and it's not pretty.
It's like Caroline Lucas and Clair Hawkins have hacked their account and are on a train of unconsciousness.
https://twitter.com/ToryEnergy
Barry how by the teeth of Golallian can you admit that you still support this ridiculous crew? - i don't think many care how we get our electricity and gas as long as we get it and at a reasonable price.
this does not filter through to our pious politicos who are determined to be "green" even though germany - the birth place of all things green has turned its back on it.
There are quite a few graphs within the pdf linked to below. All in all, it is plain to see that no matter how much the country has coming in, a deficit is a 'fine thing'.
http://www.peakoil.net/Publications/06_Analysis_of_UK_oil_production.pdf